

 Price Drop Again?")

The Dogecoin (DOGE) price increased significantly on January 20 but fell sharply the next day.
DOGE trades inside the support area of a bearish pattern in place for nearly two months. Can it reverse its trend with a bounce, or will Dogecoin break down?
Dogecoin Suffers Rejection
The technical analysis of the daily time frame shows that the DOGE price has traded inside an ascending parallel channel since June 2023.
In December, the price broke out from the channel, culminating with a high of $0.108. However, Dogecoin dropped afterward, decreasing inside the channel’s confines on January 3, 2024.
Since then, it made two unsuccessful breakout attempts (red icons), leaving upper wicks in place. The second rejection occurred shortly after Elon Musk introduced an “X Payments” account on its platform.
The daily Relative Strength Index (RSI) gives a bearish reading. The RSI is a momentum indicator traders use to evaluate whether a market is overbought or oversold and whether to accumulate or sell an asset.
Readings above 50 and an upward trend suggest that bulls still have an advantage, while readings below 50 indicate the opposite. The RSI is below 50 and falling (red circle), both signs of a bearish trend.
Read More: Dogecoin vs. Bitcoin: An Ultimate Comparison
DOGE Price Prediction: What to Make of Bearish Pattern?
Like the daily time frame, the six-hour one gives a bearish outlook. This is because of the DOGE price action and RSI readings.
The price action shows that Dogecoin has decreased under a descending resistance trend line since the December 2023 high mentioned above. More recently, the trend line caused a rejection (red icon) on January 21, 2024.
Read More: How to Buy Dogecoin (DOGE) Anonymously
The resistance trend line creates a descending triangle, considered a bearish pattern when combined with the $0.077 horizontal area.
The six-hour RSI supports the decrease since it is below 50 and falling (red circle). A breakdown that travels the entire pattern’s height will cause a 27% Dogecoin drop, taking the price to the closest support at $0.058.
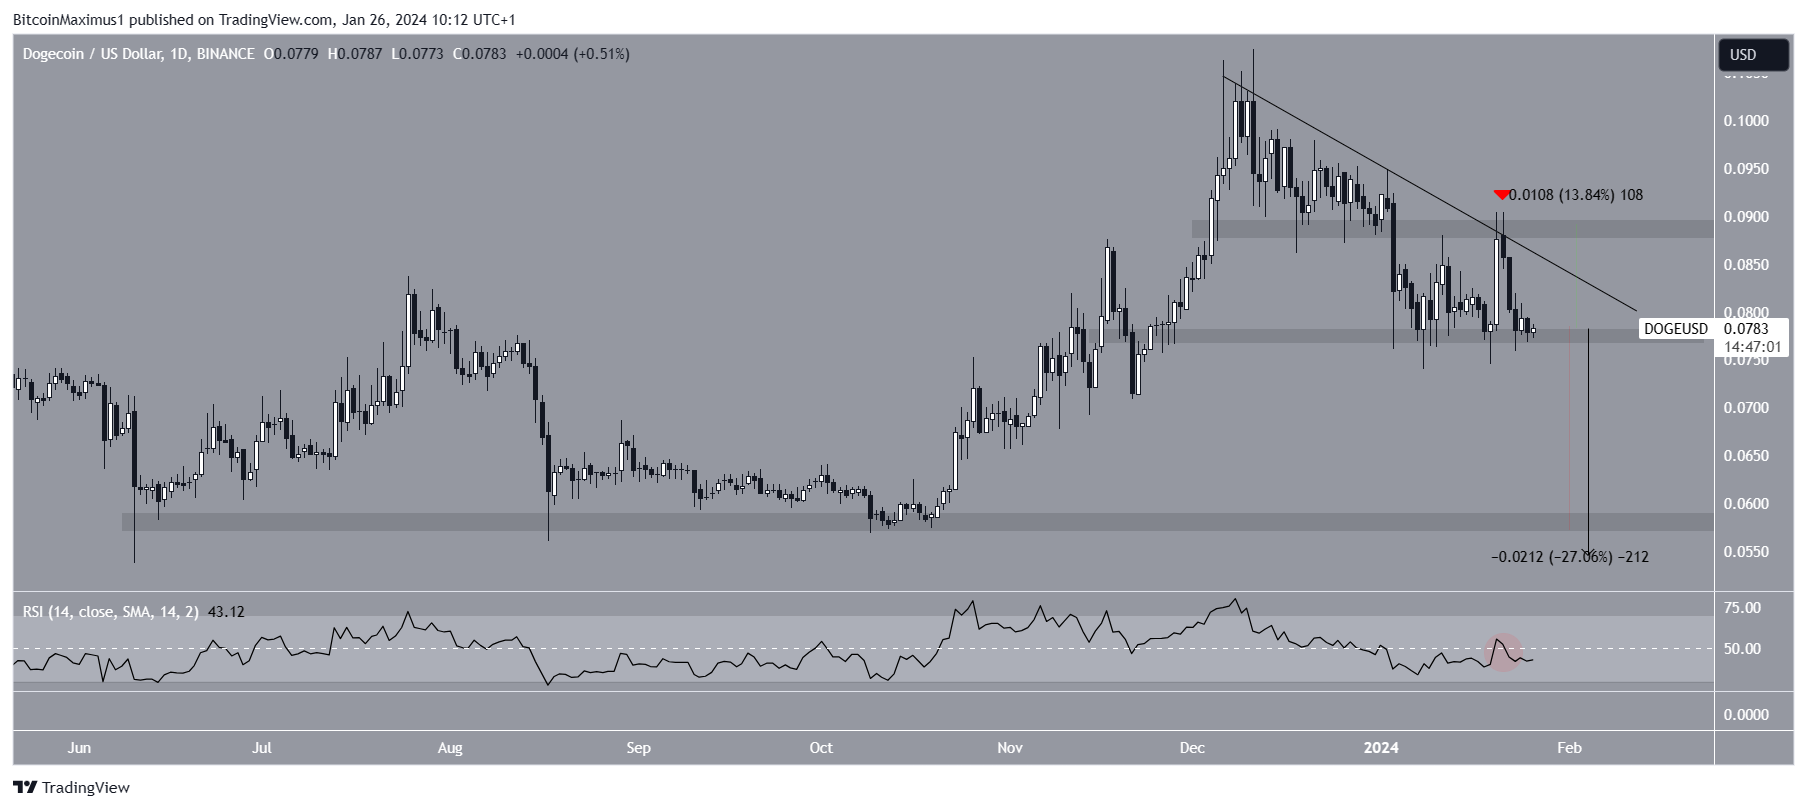
Despite this bearish DOGE price prediction, a breakout from the short-term descending resistance trend line can cause a 14% increase to the closest resistance at $0.088.
For BeInCrypto‘s latest crypto market analysis, click here.
Disclaimer
In line with the Trust Project guidelines, this price analysis article is for informational purposes only and should not be considered financial or investment advice. BeInCrypto is committed to accurate, unbiased reporting, but market conditions are subject to change without notice. Always conduct your own research and consult with a professional before making any financial decisions. Please note that our Terms and Conditions, Privacy Policy, and Disclaimers have been updated.


Be the first to comment