Key Takeaways
Bitcoin’s approach to the 200-day MA could signal a new bullish trend.
Minimal liquidations indicate cautious trading and limited downward pressure.
Share this article
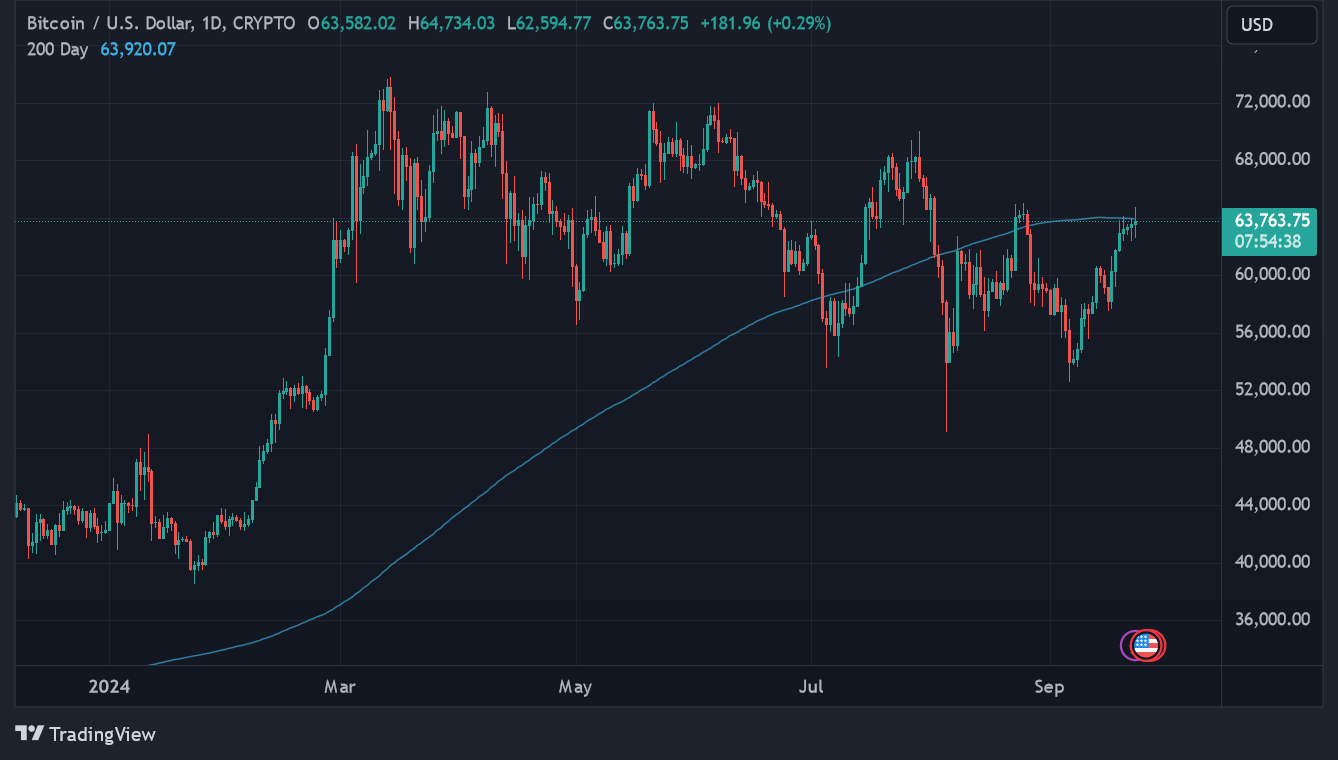
Bitcoin has been trying to push past its 200-day moving average (MA), currently sitting at roughly $64,000, for the past five consecutive days. Historically, rising above the 200-day MA signals further upward momentum, serving as a key indicator of long-term market sentiment.

Bitcoin has surged over 5% since the Federal Reserve rate cut announcement, reaching $63.5k and approaching the critical $64k level of the 200-day moving average.
As Bitcoin hovers near the 200-day MA, CoinGlass reports $7 million in long liquidations and $5 million in short liquidations. The low liquidation levels indicate cautious trading and limited downward pressure, hinting at potential bullish momentum.

In October 2023, Bitcoin also rallied past its 200-day MA, which was then around $28,000. That breakout was triggered by the anticipation of a spot Bitcoin ETF approval in the US, driving a powerful rally that eventually saw Bitcoin hit all-time highs of over $70,000 by March.
This time around, multiple factors are once again aligning to support a breakout. With the approval of options trading for BlackRock’s Bitcoin ETF and growing institutional interest in crypto, many believe Bitcoin could soon return to the post-ETF announcement price range of $64,000 to $74,000. A sustained push above the 200-day MA could signal the start of a new uptrend, drawing in even more investors.
Despite some sideways trading action over the past six months, Bitcoin has delivered stellar long-term returns. Over the past year, the token is up a staggering 142%, far outpacing traditional asset classes like the S&P 500 (+32%) and the Dow Jones Index (+24%). Compared to high-profile stocks like Apple (+31%) and Tesla (-1%), Bitcoin remains an attractive investment for those seeking growth potential.
Share this article


Be the first to comment