On-chain data shows the Bitcoin exchange whale ratio has declined recently as the crypto surges above the $24k mark.
Bitcoin Exchange Whale Ratio (EMA 7) Is Currently Below 0.50
As per a post from CryptoQuant, the BTC exchange whale ratio has gone down recently while the price has surged up.
The “exchange whale ratio” is an indicator that measures the ratio between the sum of the top 10 Bitcoin transactions to exchanges and the total exchange inflows.
exchange whale ratio = sum of top 10 inflow txs (in BTC) ÷ total exchange inflows (in BTC)
Here, the ten largest transfers are considered as they generally belong to the whales. Thus, when the value of the ratio is high, it means whales are making up for a large part of the total inflows right now.
Since investors usually send their BTC to exchanges for selling purposes, this trend can be a sign that whales are dumping at the moment. and hence can be bearish for the crypto’s price.
On the other hand, low values of the metric can suggest whales are currently occupying a normal amount of the total inflows. Such a trend could be either neutral or bullish for the coin’s value.
Now, here is a chart that shows the trend in the 7-day exponential moving-average Bitcoin exchange whale ratio over the past month:
The EMA-7 value of the metric looks to have been down in recent days | Source: CryptoQuant
As you can see in the above graph, the Bitcoin exchange whale ratio (EMA-7) has been below a value of 0.50 for seven out of the last eight days.
The 0.50 mark is the dumping threshold for the EMA-7 version of the metric and as the indicator has been below this value recently, the selling pressure from whales has been low.
While the ratio has gone down, BTC’s price has enjoyed some upwards momentum as the coin surged up above the $24k mark earlier today.
BTC Price
At the time of writing, Bitcoin’s price floats around $23.5k, down 1% in the last seven days. Over the past month, the crypto has gained 15% in value.
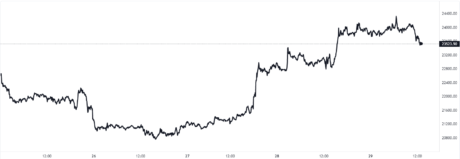
The below chart shows the trend in the price of the coin over the last five days.

Looks like the value of the crypto has observed some upwards movement during the last couple of days | Source: BTCUSD on TradingView
Around ten days ago Bitcoin had recovered above $23k, but only a few days later the crypto’s price again started to go downhill. However, in the last couple of days, the coin enjoyed some sharp upwards momentum as it retook $23k.
Earlier today, BTC even broke above $24k, though it wasn’t long before the crypto saw a slump and came down to the current level.
Featured image from Karl-Heinz Müller on Unsplash.com, charts from TradingView.com, CryptoQuant.com


Be the first to comment