Bitcoin and the Nasdaq 100 index have a positive correlation
The two markets’ performances offer a way to trade Bitcoin
Volatility is key in interpreting the positive correlation
Bitcoin and the cryptocurrency market gained in popularity in a relatively short period. Since its birth, Bitcoin has been adopted by institutional investors, making its price action closer to traditional markets.
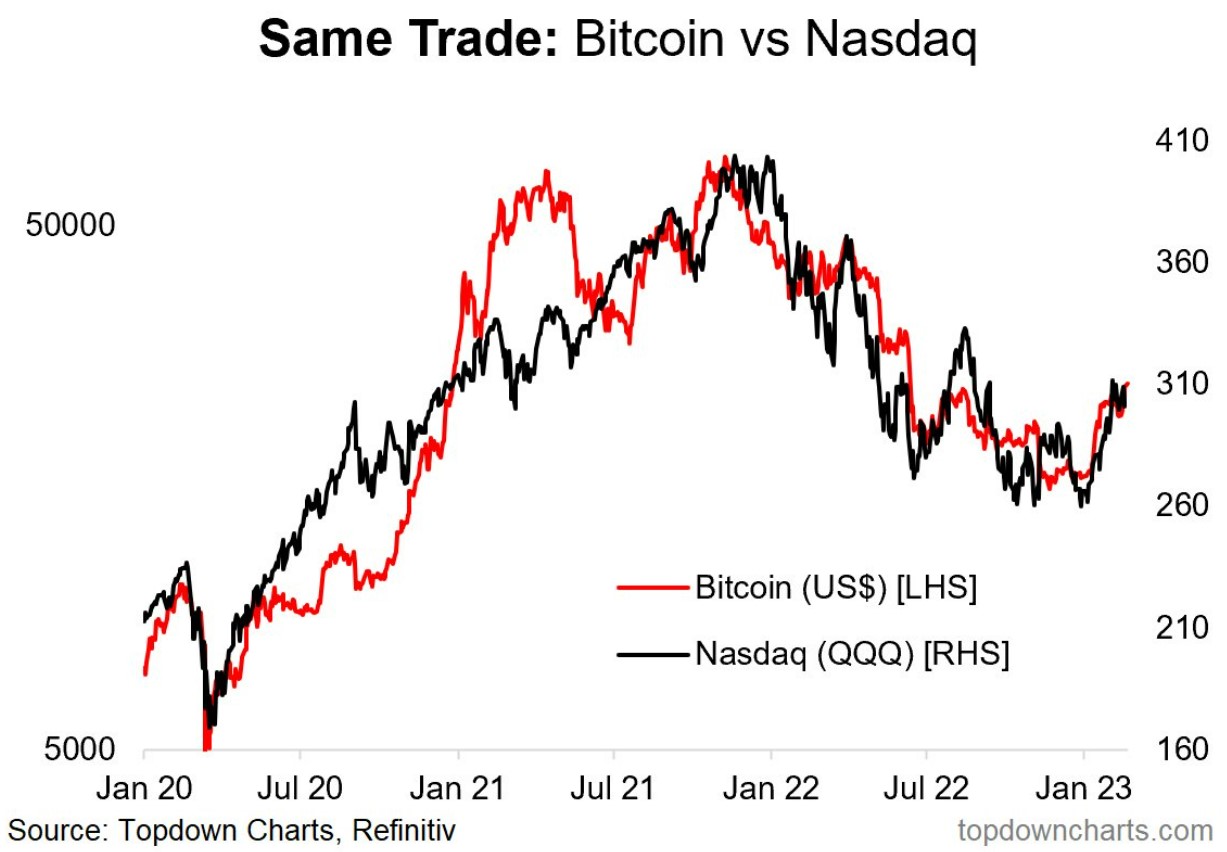
As such, it positively correlates with the stock market, particularly with the Nasdaq 100 index. As seen below, buying or selling Bitcoin or buying or selling the Nasdaq 100 index was basically the same trade in the last two years.

However, such charts are misleading. While correct, the chart above ignores the increased volatility in the cryptocurrency market, one that requires special money management skills from crypto retail traders.
The positive correlation suggests more upside for Bitcoin
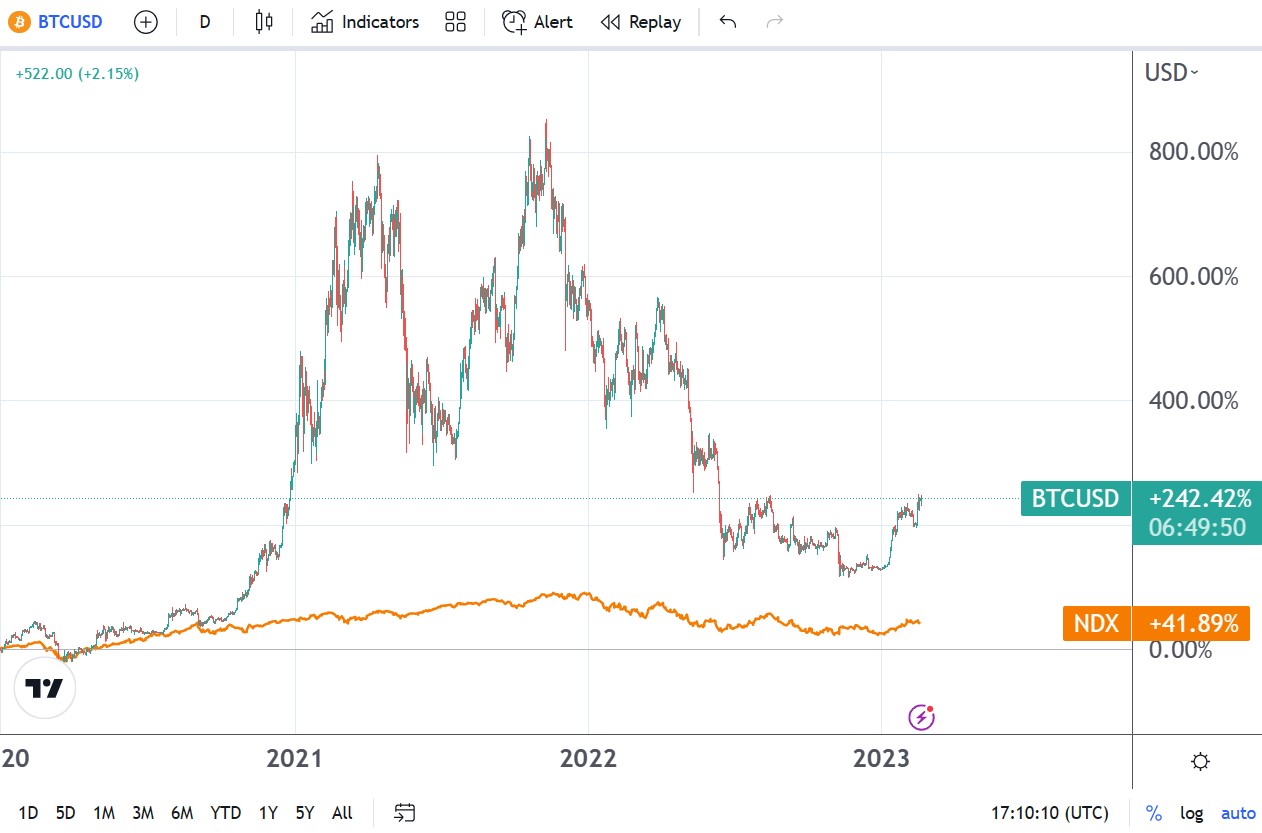
An interesting perspective appears if we take into perspective the two markets’ volatility. The chart below shows the last two years’ performance for both – Bitcoin delivered +242.42% while the Nasdaq 100 +41.89%.

BTCUSD chart by TradingView
Both performances are impressive, especially if we consider the 2022 bear market. Bitcoin topped when the Nasdaq 100 index topped, and then the market collapsed as investors fled the tech sector and the cryptocurrency market.
Judging by the positive correlation, one thing is sure – the closer the two markets’ performance is, the more appealing it is to buy Bitcoin. Since the end of 2020, the gap between the two performances has never been so narrow as in late 2022.
In other words, the rally seen in the first trading weeks of 2023 should not surprise anyone, given the nature of this correlation. As the tech sector bounced from the lows, so did Bitcoin. Only that Bitcoin’s rally outperformed the Nasdaq 100 index’s rally because of the historically higher volatility.
To sum up, such a chart is useful when trading Bitcoin. The closer the two performances are, the bigger the case for buying Bitcoin.
On the contrary, as Bitcoin outperforms Nasdaq, the bigger the case for selling Bitcoin.


Be the first to comment