Join Our Telegram channel to stay up to date on breaking news coverage
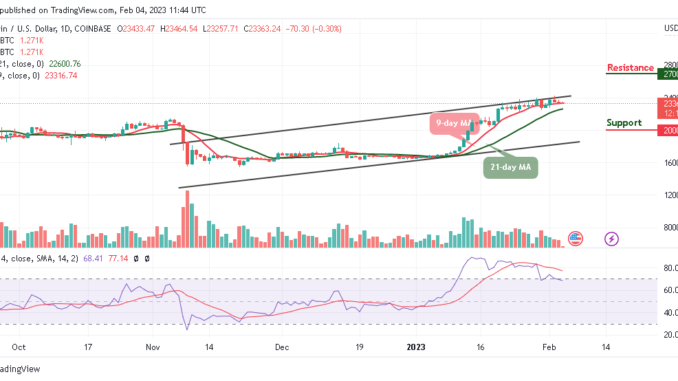
The Bitcoin price prediction shows that BTC is trading at $23,363 as the first digital asset seems to be preparing for a bearish movement.
Bitcoin Prediction Statistics Data:
Bitcoin price now – $23,363
Bitcoin market cap – $450.8 billion
Bitcoin circulating supply – 19.2 million
Bitcoin total supply – 19.2 million
Bitcoin Coinmarketcap ranking – #1
BTC/USD Long-term Trend: Bearish (Daily Chart)
Key levels:
Resistance Levels: $27,000, $28,000, $29,000
Support Levels: $20,000, $19,000, $18,000
Despite carrying the highest market capitalization in the crypto market, BTC/USD seems to be waiting for an opportunity for a breakout in either a positive or negative direction. The first digital crypto is likely to cross below the 9-day and 21-day moving averages if the sellers increase the selling pressure. On that note, the Bitcoin price is likely to extend the bearish movement toward the support level of $23,000 if it crosses below the 21-day moving average.
Bitcoin Price Prediction: Is $25k Resistance Coming for BTC?
Looking at the daily chart, it is likely for the Bitcoin price to touch the resistance level of $25,000 if the Bitcoin price crosses above the upper boundary of the channel. Moreover, any further bullish movement above this barrier may locate the potential resistance levels of $27,000, $28,000, and $29,000. Meanwhile, when new uptrends are gathering, traders may use the moving averages as a pivot resistance point to gauge the strength of the trend. Therefore, if BTC/USD soars above the upper boundary of the channel, it could be a sign of sustainability and could result in a bullish continuation.
On the contrary, if the BTC price fails to move up; traders may see a price cut below the moving averages, and a further low could bring the price to the support levels of $20,000, $19,000, and $18,000 respectively. For now, the Bitcoin price is likely to fall as the technical indicator Relative Strength Index (14) may cross below the 70-level.
BTC/USD Medium-term Trend: Ranging (4H Chart)
According to the 4-hour chart, the Bitcoin price is moving sideways as the bulls are likely to come back into the market. The king coin is likely to cross above the 9-day and 21-day moving averages, if not, the support level of $22,500 and below may come into focus.
However, if the bulls push the market above the moving averages, traders may expect a touch of the $24,000 resistance level, breaking this level may further push the price towards the resistance level of $24,500 and above while the technical indicator Relative Strength Index (14) moves around the 50-level, suggesting a sideways movement.
Bitcoin Alternatives
The Bitcoin price is still trending comfortably above the $23,000 level as it maintains its bullish trend. This has continued for a couple of weeks now, not all investors have embraced this bullish trend as many still expect a decline in price for the king coin. Meanwhile, investors are expected to get their hands on MEMAG tokens in the ongoing presale before the price increases. The Meta Masters Guild (MEMAG) is growing rapidly as the token continues to impress with over $2.7 million raised in presale. Excitement is building around MMG not only because of the high-potential presale but also because the project is developing the world’s first dedicated Web3 mobile gaming platform.
Meta Masters Guild – Play and Earn Crypto

Innovative P2E NFT Games Library Launching in 2023
Free to Play – No Barrier to Entry
Putting the Fun Back Into Blockchain Games
Rewards, Staking, In-Game NFTs
Real-World Community of Gamers & Traders
Round One of Token Sale Live Now – memag.io

Join Our Telegram channel to stay up to date on breaking news coverage


Be the first to comment