This year, the Solana (SOL) price has been on a bearish trend, falling more than 10%.
SOL fell below a horizontal support area and faces a short-term descending resistance trend line.
Solana Falls After Yearly High
The SOL price has increased alongside an ascending support trend line since the start of 2023. The price bounced at the trend line in September (green icon) and accelerated its rate of increase afterward.
The upward movement led to a yearly high of $126 in the year’s final week. The high was made just above the 0.382 Fib retracement resistance level. However, the SOL price has fallen since. It deviated above the Fib resistance mentioned above (red circle).
Today, Solana introduced token extensions. They will empower developers to build customized token experiences to meet their business needs. The Solana token extensions will include confidential transfers, metadata, and interest-bearing tokens.
The weekly Relative Strength Index (RSI) leans bearish. The RSI is a momentum indicator traders use to evaluate whether a market is overbought or oversold and whether to accumulate or sell an asset.
Readings above 50 and an upward trend suggest that bulls still have an advantage, while readings below 50 indicate the opposite. The weekly RSI is on a downward trend and fell below 70 this week (red icon).
Read More: How to Buy Solana (SOL) and Everything You Need to Know
SOL Price Prediction: Relief or Reversal?
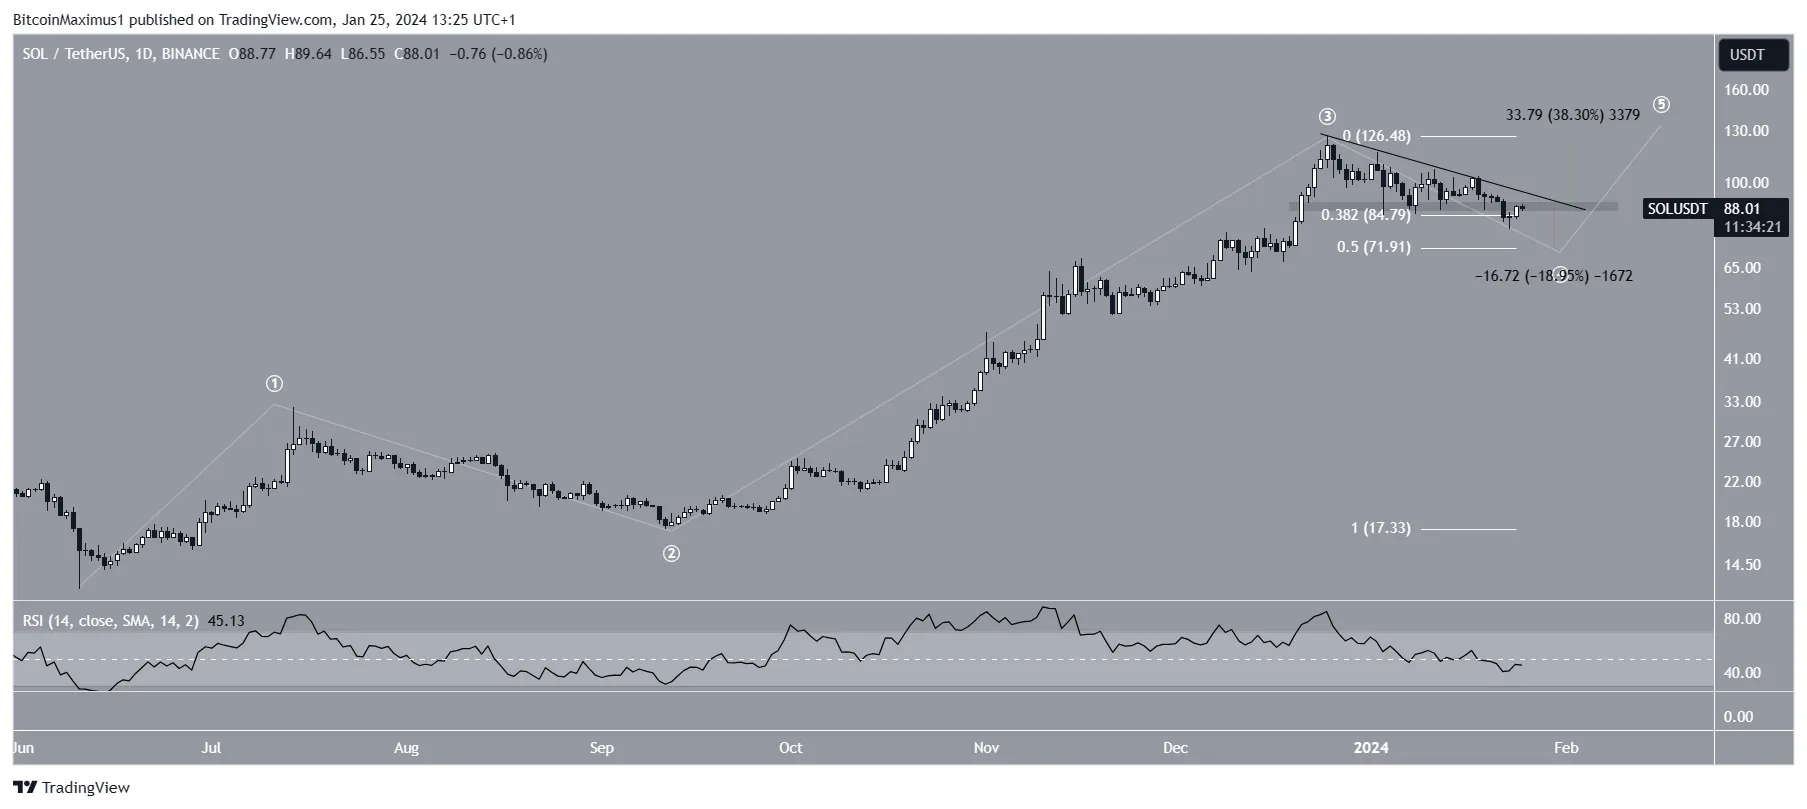
A closer look at the daily time frame suggests that SOL is still correcting. This is because of the price action, wave count, and RSI readings.
The price action shows that SOL broke down from the $90 horizontal area and validated it as resistance. Also, the daily RSI is falling below 50, a sign of a bearish trend.
Altcoin Sherpa believes the SOL price will retrace in the short term. He stated:
I think that DCAing in at the .382 and .50 are both good options for long term holds for #Solana. Not expecting things to ramp up quite yet but just be patient…
This is in line with the wave count, which suggests that SOL is in wave four of a five-wave upward movement.
Read More: Top 6 Solana Projects With Massive Potential
Technical analysts employ the Elliott Wave theory to identify recurring long-term price patterns and investor psychology, which helps them determine the direction of a trend.
If the count is correct, SOL will complete wave four at the 0.5 Fib retracement support level at $72, a 20% decrease from the current price.

Despite this bearish SOL price prediction, reclaiming the $90 area and breaking out from the descending resistance trend line will mean the bottom is in. Then, SOL can increase at least 40% to the 2023 high of $126.
For BeInCrypto’s latest crypto market analysis, click here.
Disclaimer
In line with the Trust Project guidelines, this price analysis article is for informational purposes only and should not be considered financial or investment advice. BeInCrypto is committed to accurate, unbiased reporting, but market conditions are subject to change without notice. Always conduct your own research and consult with a professional before making any financial decisions. Please note that our Terms and Conditions, Privacy Policy, and Disclaimers have been updated.


Be the first to comment