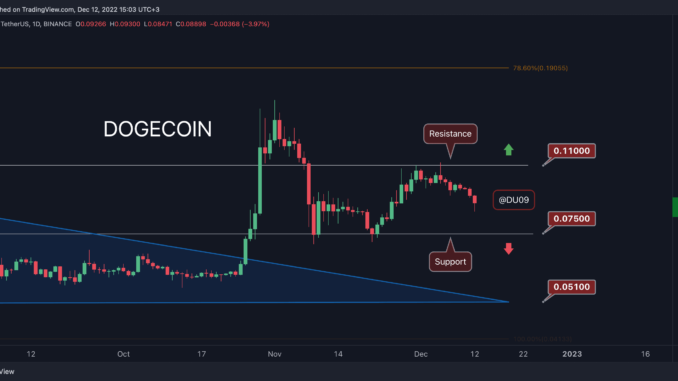
DOGE has lost its sparkle after failing to move beyond the key resistance. This put bears in charge, and they seem eager to take the price lower.
Dogecoin Price Analysis
Key Support levels: $0.075
Key Resistance levels: $0.11
The key resistance at $0.11 has stopped the bull’s most recent attempt to move DOGE’s price higher. This has created a lower high on the chart and turned the price action bearish. Sellers appear in control now, and the price could quickly fall back on the support at $0.075.
Technical Indicators
Trading Volume: The volume is flat and closed in red for the past two weeks. This is bearish.
RSI: The daily RSI is falling and may make a lower low at this rate. Since the RSI is now under 50 points, the outlook leans toward negative.
MACD: The daily MACD made a bearish cross last Friday, and the selling momentum has intensified since. The most recent rejection at the key resistance has emboldened bears.
Bias
The bias for DOGE is bearish.
Short-Term Prediction for DOGE Price
Dogecoin is found in a large correction after its parabolic rise in late October. The current price action suggests that DOGE seems more likely to re-test the key support at $0.075 before buyers eventually return.
Binance Free $100 (Exclusive): Use this link to register and receive $100 free and 10% off fees on Binance Futures first month (terms).
PrimeXBT Special Offer: Use this link to register & enter POTATO50 code to receive up to $7,000 on your deposits.
Disclaimer: Information found on CryptoPotato is those of writers quoted. It does not represent the opinions of CryptoPotato on whether to buy, sell, or hold any investments. You are advised to conduct your own research before making any investment decisions. Use provided information at your own risk. See Disclaimer for more information.
Cryptocurrency charts by TradingView.


Be the first to comment