Polkadot joins the ETHDenver BUIDLing event on 28 February.
DOT price is down on Friday as broader markets fall following US PCE data.
The technical outlook for DOT price suggests bulls need to hold above $6.35 or bears could take control.
Polkadot will next week be one of the highlight projects at the ETHDenver 2023 summit.
While the Web3 BUIDLathon event will see the largest gathering of enthusiasts, developers and engineers in the broader Ethereum ecosystem, blockchain enthusiasts will no doubt be keen on the sharded blockchain protocol that’s Polkadot.
Polkadot’s announcement today confirmed the ecosystem will join the ETHDenver 2023 BUIDLing summit starting on 28 February. Apart from panel talks and a conference program, there will be community side events and interactive activities.
The event will run through March 5 and could be key to the DOT price action.
1/ It’s less than a week before the Polkadot ecosystem joins #ETHDenver 2023.
🧵 Check this thread for the latest info on the Polkadot #BUIDLing summit, conference program, and community side events.
📅 Events dates: February 28 – March 5🔗 To register: https://t.co/fOhV0Uk44v pic.twitter.com/xrDEieLPVf
— Polkadot (@Polkadot) February 24, 2023
Polkadot price analysis
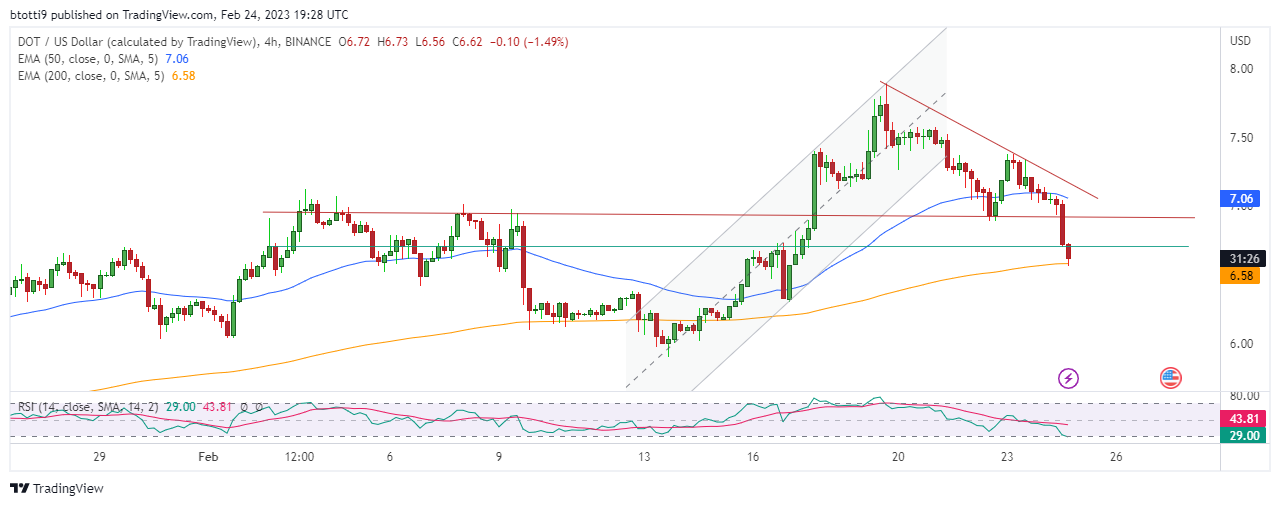
DOT is trading around $6.64, down about 6% in the past 24 hours and only 4% up in the past week. The token has formed a downtrend line since the flip negative that began on 19 February when the DOT/USD pair hit a 30-day high around $7.74.
The technical breakdown from the resistance line of the ascending channel has DOT currently at risk of free-falling, with the demand zone at $6.90 and then $6.71 gone on the 4-hour chart. If bulls fail to hold the area around $6.35, the price could plummet to the main support line at $6.00.

Polkadot price analysis 4-hour chart. Source: TradingView
Price is also below the 50 day Exponential Moving Averages (EMA), which is now the immediate resistance line. DOT is also just off the 200-day EMA as seen in the 4-hour chart.
A breakdown beyond this line could confirm a bearish flip as suggested by the sloping Relative Strength Index (RSI).
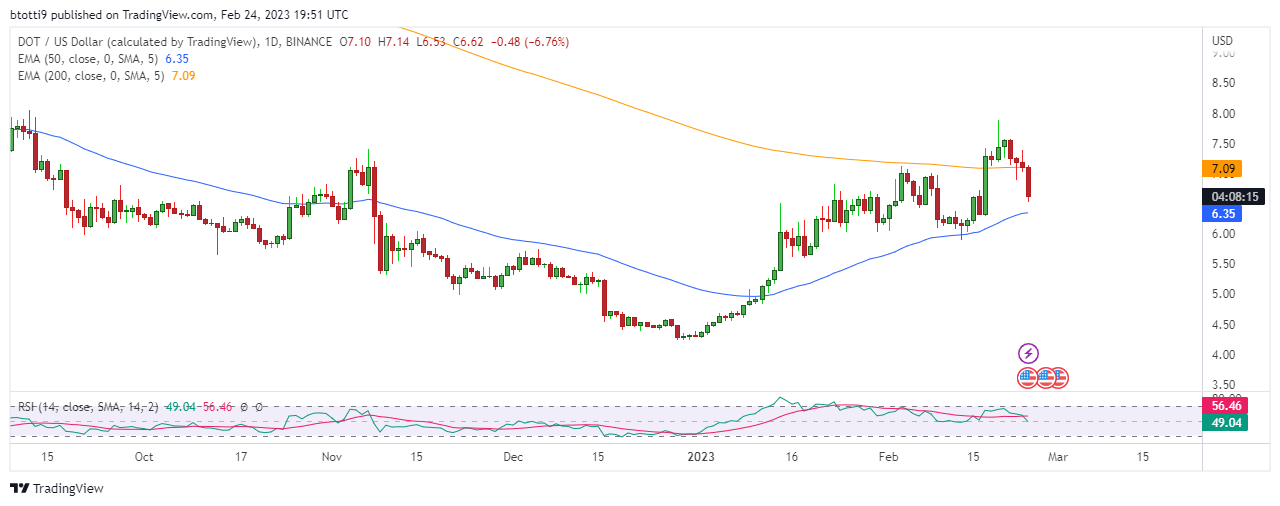
 Polkadot price chart. Source: TradingView
DOT is also in oversold territory on the daily chart, with the 50 EMA currently providing the main support line around $6.35. However, a bounce off the lower trendline of the ascending channel suggests bulls still have a chance of pushing DOT higher.
Whether this happens during the ETHDenver summit or later may nonetheless depend on the overall market outlook, particularly what Bitcoin price does over the next few days.


Be the first to comment