The price of Near Protocol (NEAR) showed bullish signs of going higher to a region of $6-$7, but the price was rejected back to its support area, where it has found high demand for its price. Bitcoin (BTC) and Ethereum (ETH) all saw a relief bounce from their monthly low, leading to altcoins like Near Protocol (NEAR) having a measure of relief bounce. (Data from Binance)
Near Protocol (NEAR) Price Analysis On The Weekly Chart
The price of NEAR showed some great bullish strength after breaking above its weekly resistance of $4.7 and traded to a high of $5.9 before seeing a rejection back to its key support area.
NEAR’s price has again shown bullish strength after closing the week, looking bearish on the weekly chart.
The price of NEAR is currently trading below a key resistance on the weekly timeframe; NEAR needs to break this resistance with good volume to have a chance of trending higher to a region of $6 and possibly $7.
Weekly resistance for the price of NEAR – $4.7,$6.
Weekly support for the price of NEAR – $3.
Price Analysis Of NEAR On The Daily (1D) Chart
The price of NEAR found its daily low at $3.7, forming good support as the price bounced off the area. NEAR price has rallied to a region of $4.7, where it has been faced with resistance to breaking above for the price of NEAR to trend to higher heights.
Despite being rejected in recent times from the $6 mark, NEAR price has shown great bullish strength; the price of NEAR is trading at $4.3 below the daily 50-day and 200-day Exponential Moving Average (EMA).
The 50 and 200 EMA correspond to prices of $4.5 and $6.7, respectively, acting as resistances for the price of NEAR to trend higher. If the NEAR price breaks and holds above the $4.7 corresponding to the 50 EMA, we could see the price trending higher to a region of $7.
If NEAR price fails to break above its resistances, then prices would find more momentum at its support of $3.7 or even lower.
Daily (1D) resistance for the NEAR price – $4.7, $6.7.
Daily (1D) support for the NEAR price – $3.7, $3.
Price Analysis Of NEAR On The Four-Hourly (4H) Chart

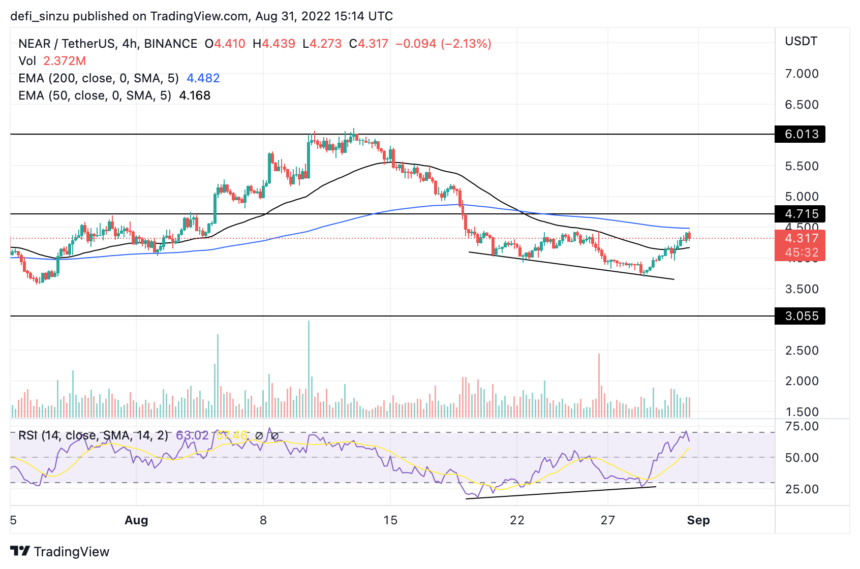
The price of NEAR on the 4H chart has continued to look bullish, trying to hold above the support area at $4.2. NEAR price currently trades above the 50 EMA on the 4H chart, with more buyers willing to push the price higher.
After forming a bullish divergence on the 4H chart as the price was oversold, the NEAR price rallied to $4.4 after breaking above the 50 EMA and holding above it; the 50 EMA price corresponds to the support at $4.2.
The price of NEAR is faced with resistance on the 4H chart, preventing the price from breaking higher.
The Relative Strength Index (RSI) for NEAR on the 4H chart is above 70, indicating more buy order volume for the NEAR price.
Four-Hourly (4H) resistance for the NEAR price – $4.5.
Four-Hourly (4H) support for the NEAR price – $4.2, $4.
Featured Image From zipmex, Charts From TradingView.com


Be the first to comment