The price of Bonk is currently poised within a bullish continuation pattern, hinting at a possible 60% rally for the meme coin.
This optimistic scenario hinges on BONK holders maintaining a positive outlook on the asset’s future.
Bonk’s Potential for Another Rally
At present, Bonk’s price is showing bullish signs, suggesting a potential recovery is on the horizon. A common hurdle for meme coins is sustaining investor optimism after a correction, as many investors aim for quick gains and typically engage more actively when prices are already on the rise.
However, BONK traders currently appear to be optimistic, as evidenced by the positive Funding Rate despite recent price dips. A positive funding rate indicates that traders are leaning towards long positions in the futures market, reflecting bullish expectations for the meme coin.
Read More: 13 Best Solana Meme Coins to Watch in 2024
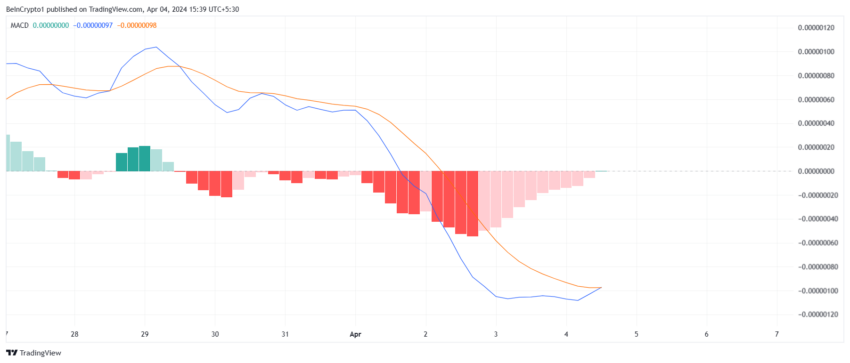
Additionally, the Moving Average Convergence Divergence (MACD), a momentum indicator used to identify trend directions, signals bullish momentum. The MACD is currently hinting at a bullish crossover, marked by a green bar on the histogram, suggesting a potential price increase.

BONK Price Prediction: Bullish
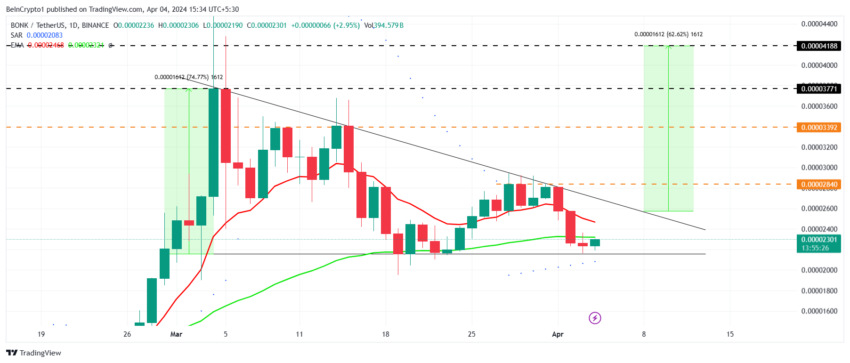
As of now, Bonk’s price is navigating a descending triangle pattern, characterized by the price forming lower highs while maintaining a stable low. This pattern typically indicates a continuation of the current trend, with the possibility of a breakout leading to a significant rally.
For BONK, a successful breakout from this pattern could result in a 62% surge to a target of $0.00004188, contingent upon overcoming multiple resistance levels.

It is important to note that Open Interest (OI) has consistently declined. OI represents the total number of outstanding derivative contracts, such as futures or options, and a decrease suggests a reduction in both long and short positions.
This decline in OI might indicate waning investor optimism, potentially leading to a price correction. If BONK falls below the key support level of $0.00002157, the bullish scenario would be negated, potentially leading to further losses.
Disclaimer
In line with the Trust Project guidelines, this price analysis article is for informational purposes only and should not be considered financial or investment advice. BeInCrypto is committed to accurate, unbiased reporting, but market conditions are subject to change without notice. Always conduct your own research and consult with a professional before making any financial decisions. Please note that our Terms and Conditions, Privacy Policy, and Disclaimers have been updated.


Be the first to comment